

Usage steps
-
Choose the date control, then select a preset or Custom Date. Use the agent selector to narrow the report.
-
Review Total Calls, Connected, Connected Successful, Positive Calls and Total Duration. Use the information buttons to read the metric definitions.
-
Inspect Connection overview and its Trend or Line presentation. Use the connected and not-connected breakdowns to understand the composition of the total.
-
Select a metric or disposition link to open the matching Calls view. Investigate individual examples before drawing conclusions.
-
Review the disposition waterfall, sentiment availability and Agent performance. Use Refresh data or an Export dashboard control when needed.
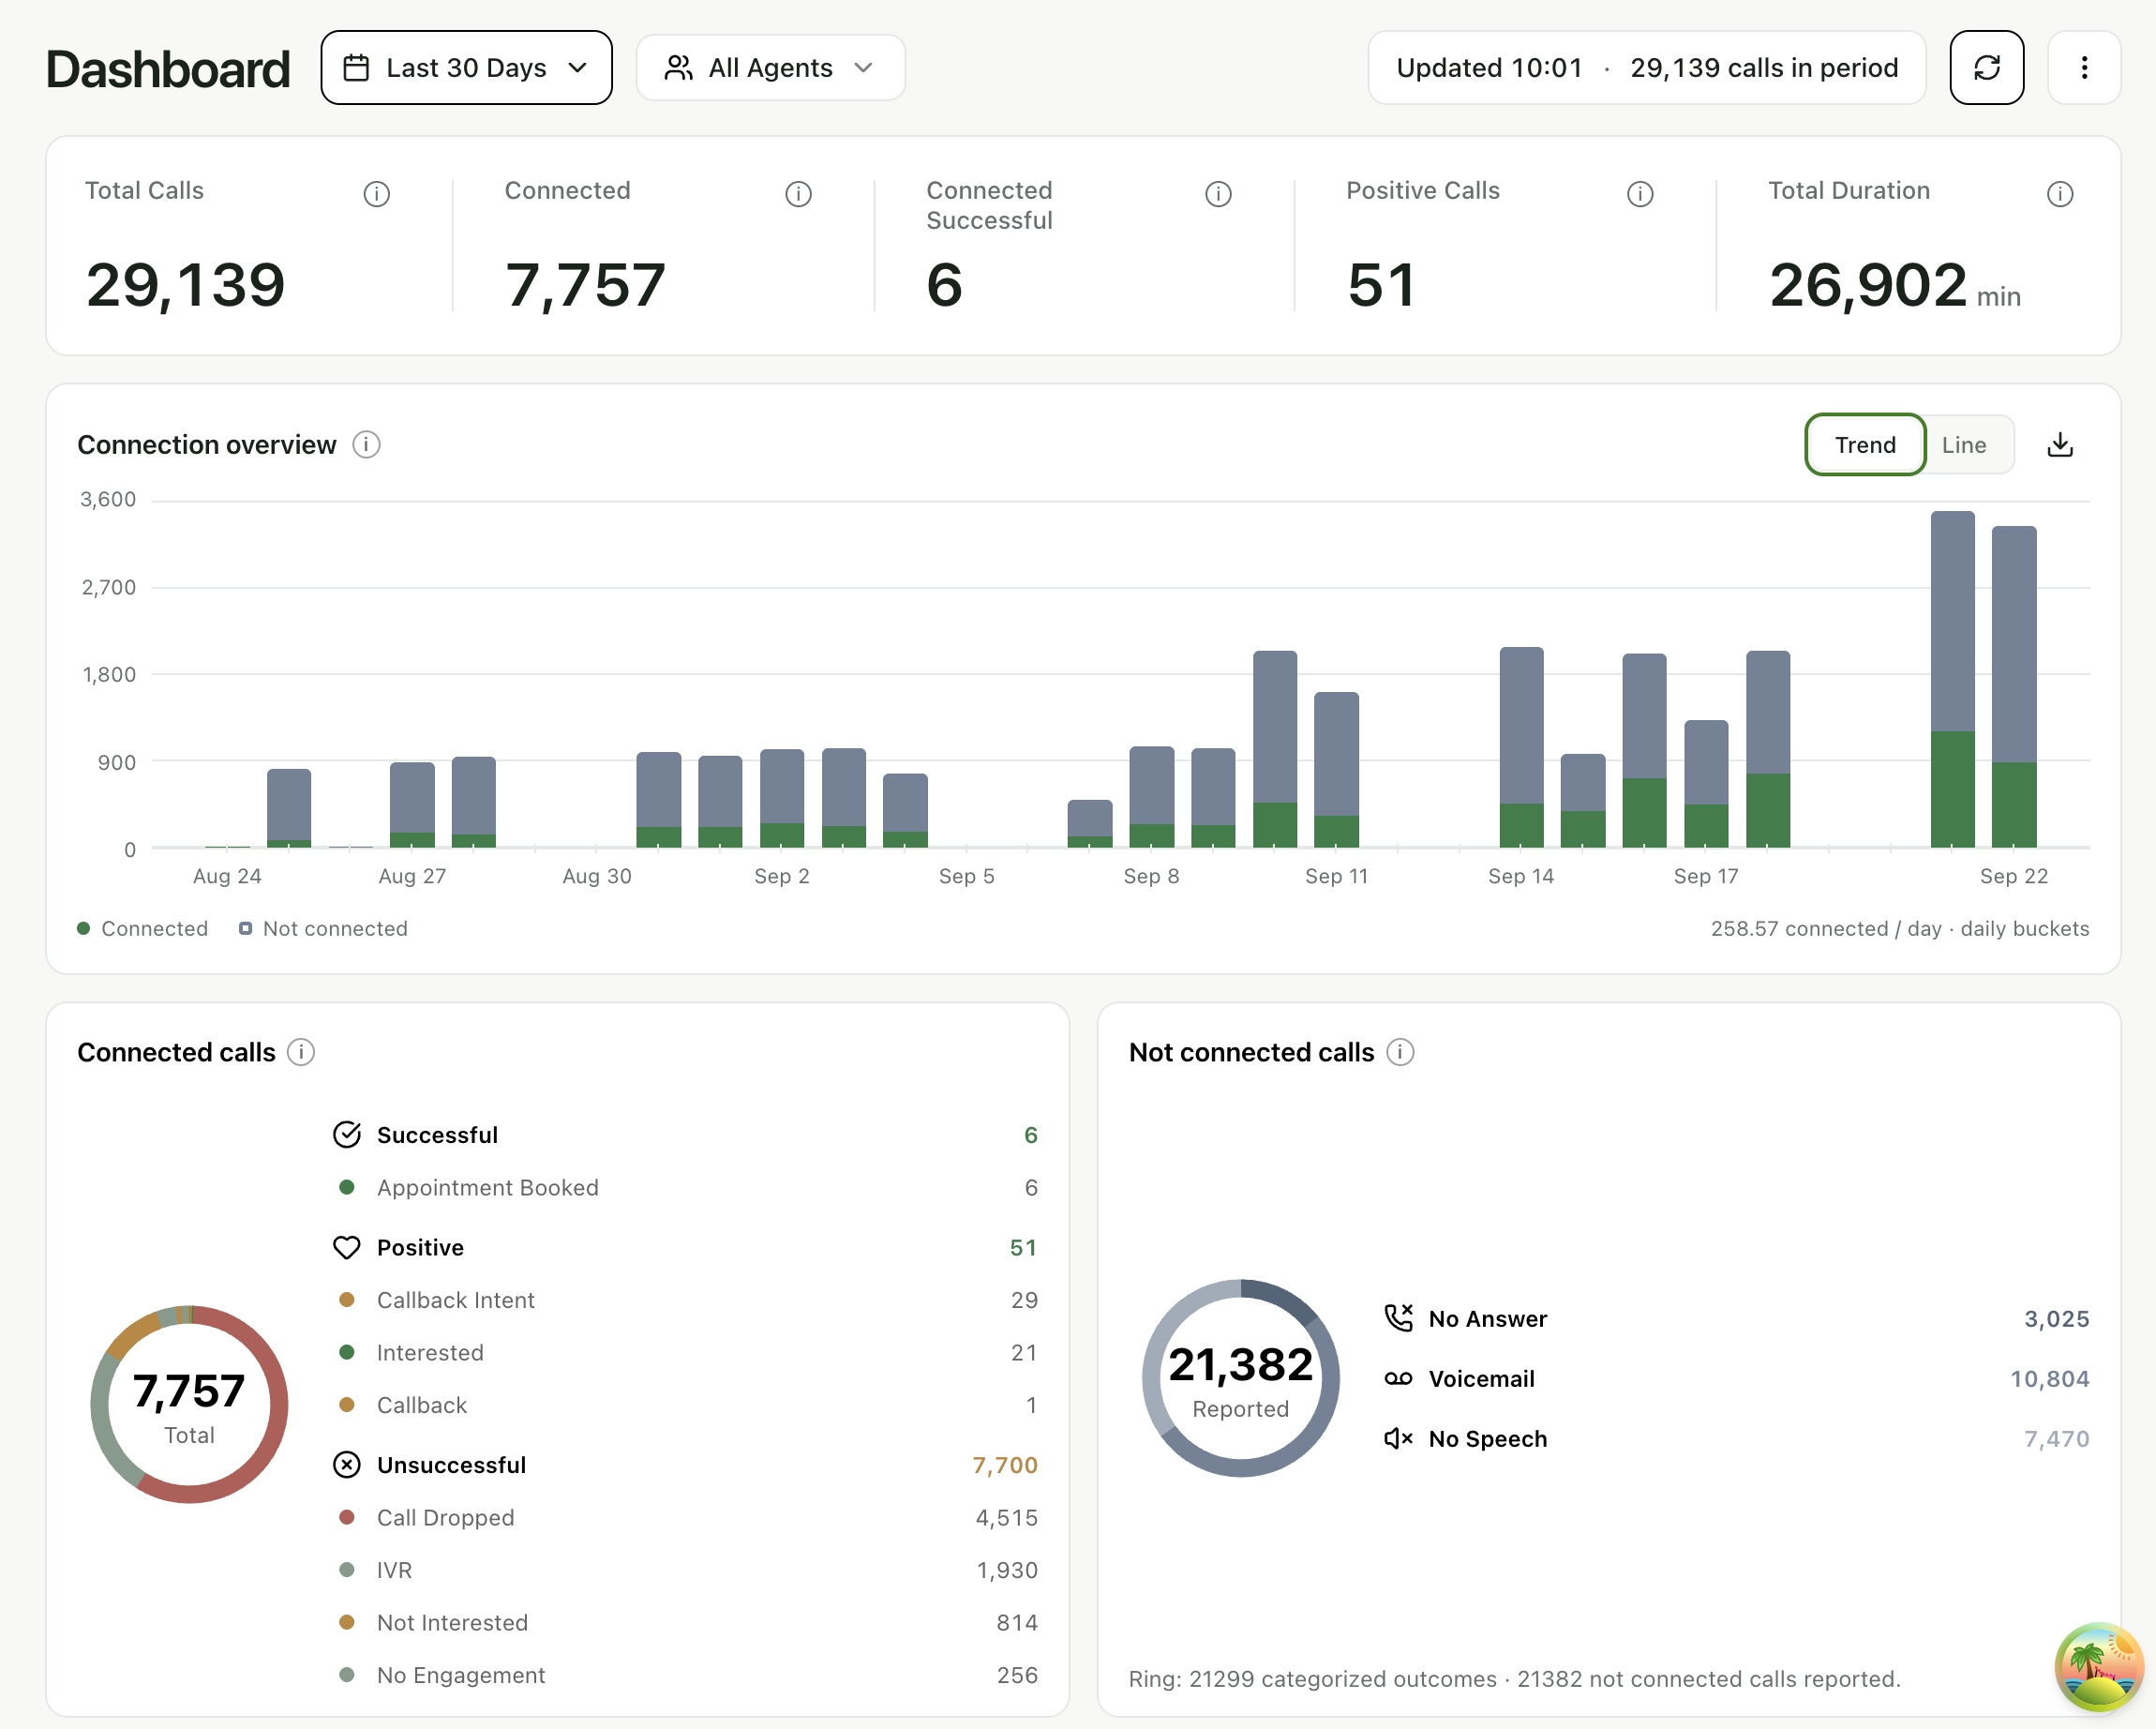
Expected result. You can trace a performance observation to the calls that explain it.
Practical notes and troubleshooting. Connected does not necessarily mean the business goal was achieved. Review the successful, positive and unsuccessful outcome groups separately.